DevOps Tools Every Engineer Should Learn
Sponsor message — This article is made possible by Dargslan.com, a publisher of practical, no-fluff IT & developer workbooks.
Why Dargslan.com?
If you prefer doing over endless theory, Dargslan’s titles are built for you. Every workbook focuses on skills you can apply the same day—server hardening, Linux one-liners, PowerShell for admins, Python automation, cloud basics, and more.
DevOps Tools Every Engineer Should Learn
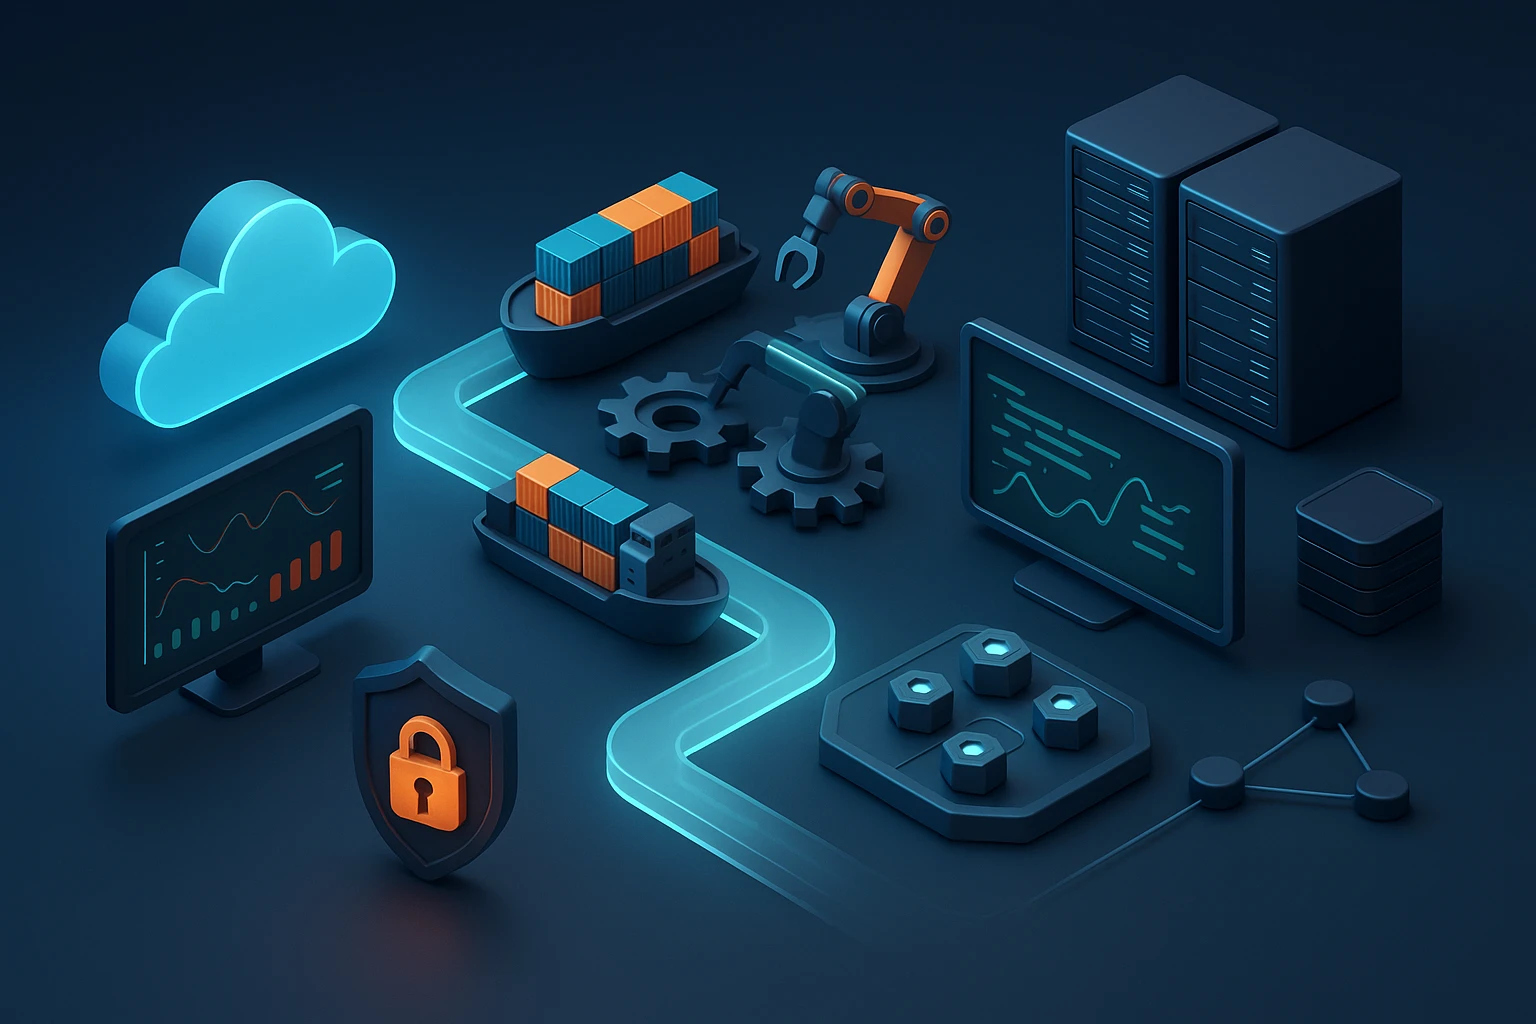
The modern software development landscape demands a fundamental shift in how we build, deploy, and maintain applications. DevOps practices have become the backbone of efficient software delivery, and the tools that enable these practices are no longer optional—they're essential survival skills for any engineer who wants to remain relevant in today's competitive market. Without a solid grasp of DevOps tooling, engineers find themselves isolated from the deployment process, unable to troubleshoot production issues effectively, and disconnected from the full lifecycle of their code.
DevOps tools represent the practical implementation of collaboration, automation, and continuous improvement principles that bridge the traditional gap between development and operations teams. These technologies enable engineers to write code that not only functions correctly but can be reliably deployed, monitored, and scaled in production environments. This comprehensive exploration examines the most critical DevOps tools from multiple angles—their technical capabilities, practical applications, learning curves, and strategic importance in different organizational contexts.
Throughout this guide, you'll discover detailed insights into essential DevOps categories including version control systems, containerization platforms, orchestration frameworks, continuous integration and deployment pipelines, infrastructure as code solutions, and monitoring systems. Each tool discussion includes practical considerations for adoption, common pitfalls to avoid, and realistic assessments of the time investment required to achieve proficiency. Whether you're a developer looking to expand your operational knowledge or an operations professional seeking to understand modern development workflows, this resource provides the clarity needed to prioritize your learning journey.
Version Control: The Foundation of Collaborative Development
Version control systems serve as the absolute foundation for any DevOps practice, providing the single source of truth for code, configuration, and documentation. Git has emerged as the dominant version control system, with platforms like GitHub, GitLab, and Bitbucket building comprehensive ecosystems around it. Understanding Git goes far beyond basic commands—it requires grasping branching strategies, merge conflict resolution, rebase workflows, and how to structure repositories for optimal collaboration.
The distributed nature of Git fundamentally changed how teams collaborate on code. Unlike centralized version control systems, every developer maintains a complete copy of the repository history, enabling offline work and creating natural backup redundancy. This architecture supports diverse workflows from simple trunk-based development to complex GitFlow strategies with multiple long-lived branches. Engineers must understand not just the technical mechanics but also the workflow implications of different branching models and how they align with deployment strategies.
"Version control is not just about saving your work—it's about creating a comprehensive history of decision-making that future teams can understand and learn from."
Modern Git platforms extend far beyond simple code storage. GitHub Actions, GitLab CI/CD, and Bitbucket Pipelines integrate continuous integration directly into the repository, while pull request workflows enforce code review processes. Issue tracking, project management boards, and wiki documentation create a centralized collaboration hub. Security scanning, dependency management, and automated testing integrate seamlessly into the development workflow, making the repository the orchestration point for the entire software delivery pipeline.
Advanced Git Techniques for DevOps Engineers
Mastering Git requires understanding advanced concepts that dramatically improve productivity and collaboration quality. Interactive rebase allows engineers to clean up commit history before merging, creating logical, reviewable changesets rather than messy works-in-progress. Cherry-picking enables selective application of commits across branches, essential when maintaining multiple release versions simultaneously. Submodules and subtrees provide mechanisms for managing dependencies and shared code across multiple repositories, though each approach carries distinct trade-offs in complexity and maintenance burden.
Git hooks provide powerful automation opportunities at various points in the Git workflow. Pre-commit hooks can enforce code formatting standards, run quick tests, or prevent commits containing sensitive information. Pre-push hooks might trigger more comprehensive test suites before code reaches remote repositories. Server-side hooks enable enforcement of branch protection rules, commit message standards, and integration with external systems. Understanding how to implement and distribute hooks across teams ensures consistent practices without relying solely on developer discipline.
| Git Workflow Model | Best For | Complexity Level | Deployment Alignment |
|---|---|---|---|
| Trunk-Based Development | High-frequency deployments, mature CI/CD | Low | Continuous deployment |
| GitHub Flow | Web applications, feature-based development | Medium | Deploy from main branch |
| GitFlow | Scheduled releases, multiple versions | High | Release branch deployment |
| Forking Workflow | Open source projects, external contributors | Medium | Maintainer-controlled deployment |
Containerization with Docker: Packaging Applications for Consistency
Docker revolutionized application deployment by solving the persistent "works on my machine" problem through containerization. Containers package applications with all their dependencies, libraries, and configuration files into standardized units that run identically across development laptops, testing environments, and production servers. This consistency eliminates entire categories of environment-related bugs and dramatically simplifies the deployment process. Understanding Docker means grasping both the conceptual model of containerization and the practical skills of writing efficient Dockerfiles, managing images, and orchestrating multi-container applications.
The Docker ecosystem extends far beyond the core container runtime. Docker Compose enables local development environments that mirror production architectures, defining multi-container applications in simple YAML files. Docker Hub and private registries provide centralized image storage and distribution. Docker networking creates isolated networks for container communication while exposing only necessary ports to the outside world. Volume management solves the challenge of persistent data in ephemeral containers. Mastering these components creates a complete local development and testing environment that closely resembles production.
Writing Production-Ready Dockerfiles
Creating effective Dockerfiles requires understanding layer caching, image size optimization, and security best practices. Each instruction in a Dockerfile creates a new layer, and Docker caches these layers to speed up subsequent builds. Structuring Dockerfiles to maximize cache utilization—placing less frequently changing instructions earlier and more volatile instructions later—dramatically reduces build times. Multi-stage builds enable using different base images for building and running applications, keeping final images small by excluding build tools and intermediate artifacts.
Security considerations in Docker images demand attention from the earliest stages of adoption. Using official base images from trusted sources reduces the risk of compromised dependencies. Running containers as non-root users limits the potential damage from application vulnerabilities. Scanning images for known vulnerabilities using tools like Trivy or Snyk catches security issues before deployment. Minimizing the number of installed packages reduces the attack surface. These practices transform Docker from a convenient packaging tool into a security-enhancing component of the deployment pipeline.
- 🐳 Base Image Selection: Choose minimal base images like Alpine Linux or distroless images to reduce size and attack surface, but verify compatibility with application dependencies
- 🔄 Layer Optimization: Order Dockerfile instructions from least to most frequently changing to maximize cache utilization and minimize rebuild times
- 🔒 Security Scanning: Integrate automated vulnerability scanning into CI/CD pipelines to catch security issues in dependencies before production deployment
- 📦 Multi-Stage Builds: Separate build and runtime environments to exclude unnecessary build tools from final images, reducing size and security risks
- 🗂️ Artifact Management: Use .dockerignore files to exclude unnecessary files from build context, speeding up builds and preventing accidental inclusion of secrets
"Containers don't just solve deployment problems—they fundamentally change how we think about application architecture, forcing us to design for statelessness and scalability from the beginning."
Kubernetes: Orchestrating Containers at Scale
Kubernetes emerged as the de facto standard for container orchestration, managing the deployment, scaling, and operation of containerized applications across clusters of machines. While Docker handles individual containers, Kubernetes orchestrates thousands of containers across hundreds of servers, handling failures, scaling based on demand, and managing complex networking and storage requirements. The learning curve for Kubernetes is notoriously steep, but the investment pays dividends for any organization running containerized workloads at scale.
The Kubernetes architecture consists of control plane components that manage the cluster state and worker nodes that run containerized workloads. The declarative model means engineers describe the desired state of their applications in YAML manifests, and Kubernetes continuously works to maintain that state. Pods represent the smallest deployable units, typically containing one or more tightly coupled containers. Deployments manage pod replicas and rolling updates. Services provide stable networking endpoints for dynamic pod populations. ConfigMaps and Secrets manage configuration and sensitive data separately from application code.
Kubernetes Resource Management and Scaling
Effective Kubernetes usage requires understanding resource requests and limits, which govern how much CPU and memory each container can consume. Requests guarantee minimum resources, influencing pod scheduling decisions. Limits prevent containers from consuming excessive resources and impacting other workloads. Properly configuring these values prevents both resource starvation and wasteful over-provisioning. Horizontal Pod Autoscaling automatically adjusts replica counts based on CPU utilization or custom metrics, enabling applications to handle traffic spikes without manual intervention.
Namespaces provide logical isolation within clusters, enabling multiple teams or environments to share infrastructure while maintaining separation. Resource quotas limit namespace consumption, preventing any single team from monopolizing cluster resources. Network policies control traffic flow between pods, implementing microsegmentation for security. Role-Based Access Control (RBAC) defines who can perform what actions on which resources, essential for maintaining security in multi-tenant clusters. These features transform Kubernetes from a simple orchestrator into a complete platform for running production workloads.
| Kubernetes Component | Primary Function | Key Considerations | Common Mistakes |
|---|---|---|---|
| Deployments | Manage stateless application replicas | Rolling update strategy, replica count | Not setting resource limits, inadequate health checks |
| StatefulSets | Manage stateful applications with persistent identity | Persistent volume claims, ordered deployment | Using for stateless apps, improper volume management |
| Services | Provide stable networking for dynamic pods | Service type selection, port configuration | Exposing unnecessary ports, wrong service type |
| Ingress | Manage external HTTP/HTTPS access | TLS termination, routing rules | Not configuring TLS, complex routing logic |
| ConfigMaps/Secrets | Manage configuration and sensitive data | Encryption at rest, rotation policies | Storing secrets in ConfigMaps, no rotation strategy |
"Kubernetes complexity is not accidental—it reflects the inherent complexity of running distributed systems reliably at scale, making explicit what was previously hidden in custom scripts and tribal knowledge."
Continuous Integration and Continuous Deployment Pipelines
CI/CD pipelines automate the journey from code commit to production deployment, transforming software delivery from a manual, error-prone process into a reliable, repeatable workflow. Continuous Integration ensures that code changes integrate smoothly with the existing codebase by automatically building and testing every commit. Continuous Deployment extends this automation to production releases, enabling multiple deployments per day rather than quarterly release cycles. Tools like Jenkins, GitLab CI/CD, GitHub Actions, CircleCI, and Azure DevOps provide the infrastructure for implementing these pipelines.
Effective CI/CD pipelines balance speed with safety through strategic use of automated testing, code quality checks, and deployment gates. Unit tests run quickly and catch basic logic errors. Integration tests verify that components work together correctly. End-to-end tests validate complete user workflows. Static code analysis identifies potential bugs, security vulnerabilities, and code quality issues without executing the code. Each stage provides feedback, with fast-failing tests running first to minimize wasted computation on fundamentally broken code.
Pipeline Design Patterns and Best Practices
Pipeline design significantly impacts both development velocity and deployment reliability. Trunk-based development with short-lived feature branches minimizes merge conflicts and integration problems. Feature flags decouple deployment from release, enabling code to reach production while remaining inactive until business requirements dictate activation. Blue-green deployments maintain two identical production environments, routing traffic to the new version only after validation. Canary deployments gradually shift traffic to new versions, enabling early detection of issues with minimal user impact.
Pipeline security deserves particular attention as CI/CD systems typically possess extensive permissions across infrastructure. Secrets management solutions like HashiCorp Vault, AWS Secrets Manager, or Azure Key Vault prevent hardcoding sensitive credentials in pipeline definitions. Least privilege principles limit pipeline permissions to only what's necessary for their specific tasks. Audit logging tracks all pipeline activities, enabling security investigations. Signed commits and verified builds establish chain of custody from developer workstation to production deployment.
- ⚡ Fast Feedback Loops: Structure pipelines to fail fast on common issues, running quick unit tests before slower integration tests to minimize developer wait times
- 🔐 Secrets Management: Never hardcode credentials in pipeline definitions; use dedicated secrets management solutions with rotation capabilities and audit logging
- 🎯 Environment Parity: Maintain consistent configuration across development, staging, and production environments to catch environment-specific issues early
- 📊 Pipeline Metrics: Track build success rates, deployment frequency, and mean time to recovery to identify bottlenecks and measure improvement over time
- 🚦 Deployment Gates: Implement approval workflows for production deployments while maintaining automation for lower environments to balance speed with control
Infrastructure as Code: Managing Infrastructure Through Version Control
Infrastructure as Code (IaC) applies software development practices to infrastructure management, defining servers, networks, and services in code rather than configuring them manually. This approach brings version control, code review, and automated testing to infrastructure changes, dramatically improving reliability and reproducibility. Terraform, AWS CloudFormation, Azure Resource Manager, and Pulumi represent different approaches to IaC, each with distinct philosophies and trade-offs regarding abstraction level, cloud provider support, and programming model.
Terraform has achieved particular prominence due to its cloud-agnostic approach and extensive provider ecosystem. HashiCorp Configuration Language (HCL) provides a declarative syntax for defining infrastructure resources, while Terraform's state management tracks the relationship between code and deployed resources. The plan-and-apply workflow shows proposed changes before execution, preventing accidental infrastructure destruction. Modules enable reusable infrastructure components, promoting consistency across projects and teams. Remote state storage with locking prevents concurrent modifications that could corrupt infrastructure.
Configuration Management with Ansible, Chef, and Puppet
While IaC tools like Terraform excel at provisioning infrastructure, configuration management tools specialize in configuring and maintaining software on existing servers. Ansible's agentless architecture and simple YAML syntax make it accessible to engineers without extensive programming backgrounds. Playbooks describe desired system states, and Ansible's idempotent modules ensure repeated executions produce consistent results. Chef and Puppet take different approaches with agent-based architectures and domain-specific languages, offering more sophisticated features for complex configuration scenarios at the cost of increased operational complexity.
The distinction between immutable and mutable infrastructure fundamentally shapes tool selection and operational practices. Immutable infrastructure treats servers as disposable, replacing them entirely rather than modifying them in place. This approach aligns well with containerization and cloud-native architectures, simplifying rollbacks and eliminating configuration drift. Mutable infrastructure updates existing servers, reducing deployment time and resource consumption but increasing complexity around state management and drift detection. Many organizations adopt hybrid approaches, using immutable patterns for application servers while maintaining mutable infrastructure for stateful components like databases.
"Infrastructure as Code is not just about automation—it's about making infrastructure changes reviewable, testable, and reversible, applying the same quality standards we expect from application code."
Monitoring, Logging, and Observability
Production systems require comprehensive monitoring and logging to maintain reliability and diagnose issues quickly. Monitoring tracks system health through metrics like CPU utilization, memory consumption, request rates, and error rates. Logging captures detailed event information for troubleshooting and audit purposes. Observability extends these concepts, emphasizing the ability to understand system behavior through external outputs without requiring knowledge of internal implementation details. Tools like Prometheus, Grafana, ELK Stack (Elasticsearch, Logstash, Kibana), Datadog, and New Relic provide different approaches to these challenges.
Prometheus emerged as the standard for metrics collection in cloud-native environments, particularly within Kubernetes ecosystems. Its pull-based model scrapes metrics from instrumented applications at regular intervals, storing time-series data efficiently. PromQL provides a powerful query language for analyzing metrics and creating alerts. Grafana complements Prometheus with flexible visualization capabilities, creating dashboards that surface system health at a glance. Alert Manager handles notification routing, grouping, and silencing, preventing alert fatigue while ensuring critical issues receive immediate attention.
Structured Logging and Log Aggregation
Effective logging requires structure and centralization. Structured logging formats like JSON enable programmatic log analysis, filtering, and correlation across distributed systems. Including contextual information like request IDs, user IDs, and trace IDs in every log entry enables following requests through complex microservice architectures. Log aggregation systems like the ELK Stack, Splunk, or Loki collect logs from all systems into centralized repositories, enabling comprehensive searches and analysis that would be impossible examining individual server logs.
Distributed tracing addresses the challenge of understanding request flow through microservice architectures where a single user action might trigger dozens of service calls. Tools like Jaeger, Zipkin, and AWS X-Ray instrument applications to track requests across service boundaries, visualizing the complete request path and identifying performance bottlenecks. Trace data reveals not just that a request was slow, but precisely which service calls contributed to the latency and how they relate to each other. This visibility transforms troubleshooting from guesswork into data-driven investigation.
- 📈 Metric Cardinality: Limit high-cardinality labels in metrics to prevent storage explosion and query performance degradation in time-series databases
- 🔍 Log Retention Policies: Balance storage costs against compliance requirements and troubleshooting needs when defining how long to retain different log types
- 🎯 Alert Quality: Design alerts that indicate actionable problems requiring human intervention, not just interesting events, to prevent alert fatigue
- 🌐 Distributed Context: Propagate correlation IDs through all system components to enable tracking requests across service boundaries and infrastructure layers
- ⚠️ SLO-Based Alerting: Define Service Level Objectives and alert on error budget consumption rather than arbitrary thresholds to focus on user-impacting issues
"Monitoring tells you what's broken, logging tells you why it broke, and tracing tells you where it broke—comprehensive observability requires all three perspectives working together."
Cloud Platform Fundamentals: AWS, Azure, and Google Cloud
Modern DevOps practices assume cloud deployment, making familiarity with major cloud platforms essential. Amazon Web Services (AWS), Microsoft Azure, and Google Cloud Platform (GCP) dominate the market, each offering hundreds of services covering compute, storage, networking, databases, machine learning, and more. While specific services differ, all three platforms share common concepts around regions and availability zones, identity and access management, virtual private clouds, and pay-as-you-go pricing models. Understanding these fundamentals enables engineers to work effectively regardless of which platform their organization adopts.
Core compute services form the foundation of most cloud deployments. EC2 instances on AWS, Virtual Machines on Azure, and Compute Engine on GCP provide traditional server-based compute. Managed Kubernetes services—EKS, AKS, and GKE respectively—handle cluster management complexity. Serverless compute through AWS Lambda, Azure Functions, and Google Cloud Functions eliminates server management entirely for event-driven workloads. Each model suits different use cases, with trade-offs around control, operational overhead, and cost structure that influence architectural decisions.
Cloud-Native Services and Managed Solutions
Cloud platforms provide managed services that eliminate operational burden for common infrastructure components. Managed databases like RDS, Azure SQL Database, and Cloud SQL handle backups, patching, and high availability automatically. Message queues and event streaming services enable asynchronous communication between components. Object storage provides scalable, durable storage for unstructured data. Content delivery networks accelerate global content delivery. Load balancers distribute traffic across multiple instances. These managed services allow teams to focus on application logic rather than infrastructure operations, but they also create vendor lock-in and require understanding provider-specific features and limitations.
Cloud security models follow a shared responsibility framework where the provider secures the infrastructure while customers secure their data and applications. Identity and Access Management (IAM) controls who can perform what actions on which resources. Security groups and network access control lists restrict network traffic. Encryption protects data at rest and in transit. Compliance certifications like SOC 2, ISO 27001, and HIPAA demonstrate provider security practices. Engineers must understand both provider security features and their own responsibilities to maintain secure cloud deployments.
Learning Path and Skill Development Strategy
The breadth of DevOps tooling can feel overwhelming, making a structured learning approach essential. Start with foundational skills that apply across all tools—Linux command line proficiency, basic networking concepts, and scripting in languages like Python or Bash. These fundamentals provide the context for understanding how DevOps tools work and troubleshooting when things go wrong. Version control with Git should be the first specific tool to master, as it underpins virtually all modern development workflows.
Progress from local development tools to production infrastructure gradually. Docker provides an accessible entry point to containerization with immediate local development benefits before tackling the complexity of Kubernetes. Basic CI/CD pipelines using GitHub Actions or GitLab CI/CD introduce automation concepts without requiring separate infrastructure. Cloud platform free tiers enable hands-on experimentation without financial commitment. This progression builds confidence and practical experience before tackling more complex tools and concepts.
Hands-On Practice and Real-World Projects
Reading documentation and watching tutorials provide necessary background, but practical experience cements understanding. Build personal projects that exercise multiple tools together—deploy a containerized application to Kubernetes, implement a complete CI/CD pipeline, or provision infrastructure with Terraform. Contributing to open source projects exposes you to how experienced practitioners use these tools in real-world scenarios. Deliberately breaking things in safe environments and then fixing them builds troubleshooting skills that documentation alone cannot provide.
Certifications provide structured learning paths and validate knowledge to employers, but they should complement rather than replace hands-on experience. AWS Certified Solutions Architect, Certified Kubernetes Administrator, and HashiCorp Certified Terraform Associate represent respected credentials that demonstrate proficiency. However, employers value practical experience and problem-solving ability over certification alone. Balance certification study with building real systems that demonstrate your capabilities through public GitHub repositories and detailed blog posts documenting your learning journey.
"The best DevOps engineers aren't those who memorize every tool option, but those who understand fundamental principles well enough to learn new tools quickly and choose the right tool for each situation."
Frequently Asked Questions
What is the most important DevOps tool to learn first?
Git version control should be your first priority, as it forms the foundation for all other DevOps practices. Every modern development workflow relies on Git for code management, collaboration, and integration with CI/CD pipelines. Master branching, merging, and pull request workflows before moving to other tools, as these skills apply universally regardless of your specific technology stack or cloud platform.
Do I need to learn all three major cloud platforms?
Focus on one cloud platform initially to build deep expertise rather than superficial knowledge across all three. Most concepts transfer between platforms, so mastering AWS, Azure, or GCP thoroughly prepares you to learn others quickly when necessary. Choose based on your current employer's infrastructure or job market demand in your region. Understanding multi-cloud architecture becomes valuable at senior levels, but start with depth in one platform.
How long does it take to become proficient in Kubernetes?
Achieving basic Kubernetes proficiency typically requires 3-6 months of consistent study and hands-on practice, including deploying applications, managing configurations, and troubleshooting common issues. True expertise—understanding networking, security, storage, and cluster operations deeply—takes 1-2 years of production experience. Start with managed Kubernetes services like EKS or GKE to focus on application deployment before tackling cluster administration complexities.
Should I learn configuration management tools like Ansible if I'm using containers?
Containerization reduces but doesn't eliminate the need for configuration management. Ansible remains valuable for managing container hosts, configuring networking infrastructure, and orchestrating complex deployment processes that span multiple systems. Many organizations use both containers and traditional infrastructure, requiring skills in both areas. Learn Docker and Kubernetes first, then add Ansible as needed for your specific environment.
What's the difference between monitoring and observability?
Monitoring tracks known failure modes through predefined metrics and alerts, answering "is the system healthy?" Observability enables investigating unknown problems by examining system outputs like metrics, logs, and traces, answering "why is the system behaving this way?" Modern systems require both—monitoring for known issues and observability tools for investigating novel problems. Start with basic monitoring using Prometheus and Grafana, then expand to distributed tracing and structured logging for comprehensive observability.
How do I stay current with rapidly evolving DevOps tools?
Follow key open source projects on GitHub, subscribe to newsletters like DevOps Weekly and SRE Weekly, and participate in communities around tools you use daily. Focus on understanding underlying principles rather than memorizing specific tool features, as this knowledge transfers when tools change. Dedicate time weekly to experimenting with new tools in safe environments, but resist chasing every trend—evaluate new tools against real problems you're trying to solve rather than adopting technology for its own sake.