How to Analyze Log Files Using journalctl
Short introduction
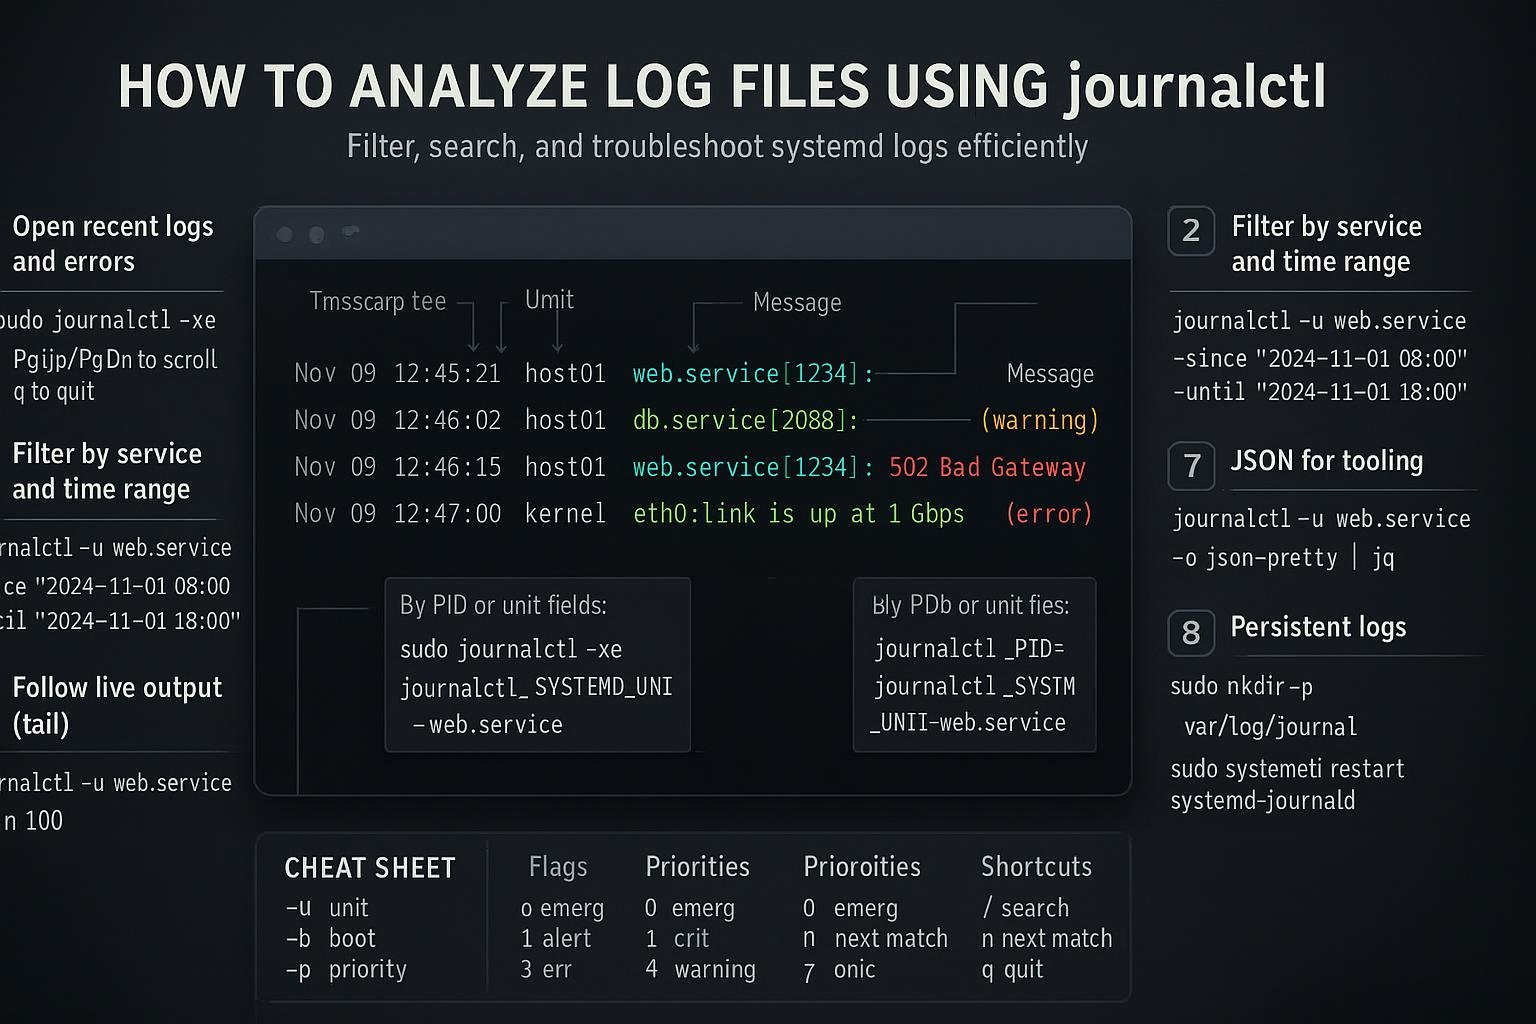
journalctl is the standard tool for reading and analyzing logs produced by systemd and many Linux services. This guide explains how the journal stores entries, shows practical viewing and filtering techniques, and includes a compact commands table so you can start investigating logs quickly.
How journalctl and the systemd journal work
The systemd journal is a binary log store maintained by systemd-journald. Unlike plain-text logs, the journal records structured entries with fields (timestamp, unit, PID, priority, message, and many more). journalctl is the command-line interface to query and render those entries; it converts the journal’s binary format into readable text and supports rich filtering, export formats (JSON), and continuous follow mode.
Important concepts:
- Volatile vs persistent storage: by default the journal may live in memory (/run/log/journal) and be lost on reboot. Making logs persistent stores them under /var/log/journal.
- Structured fields: each entry has metadata like _SYSTEMD_UNIT, _PID, _COMM, PRIORITY, MESSAGE, etc.
- Output formats: text (-o short), JSON (-o json), JSON-pretty (-o json-pretty), and export modes.
Example: see the journalctl version and a verbose entry
# Show journalctl version and the systemd journal version info
journalctl --version

# Show one verbose journal entry for inspection (most recent)
journalctl -n 1 -o verbose
The verbose output reveals many metadata fields you can filter on; later sections show how.
Basic viewing, time filtering and quick commands
This section covers everyday operations: view the latest logs, follow live logs, show logs for a service, and limit by time. Below is a short commands table with commonly used journalctl options and their purpose.
| Command / Option | What it does |
|---|---|
| journalctl -e | Jump to the end (latest entries) |
| journalctl -f | Follow (like tail -f) |
| journalctl -u sshd.service | Show logs for a systemd service |
| journalctl -b | Logs from the current boot |
| journalctl -b -1 | Logs from previous boot |
| journalctl --since "2025-01-01" --until "2025-01-02" | Time range filter |
| journalctl -p err | Show error (priority) and higher |
| journalctl -n 100 | Show last 100 lines |
| journalctl -o json | Output in JSON format |
Examples:
# Show the last 50 entries in the journal
journalctl -n 50

# Follow the journal live (press Ctrl+C to stop)
journalctl -f

# Show logs for a specific service (sshd)
journalctl -u sshd.service

# Show logs since yesterday 08:00 until now
journalctl --since "yesterday 08:00"
Time filtering supports flexible expressions:
# Exact timestamps
journalctl --since "2025-02-10 14:00:00" --until "2025-02-10 15:30:00"

# Relative times
journalctl --since "2 hours ago"
These commands are the bread-and-butter for quick inspection of failures, restarts, and boot-time messages.
Filtering, searching and advanced usage
Once you know how to view logs, you’ll want to filter by fields and priorities or export for analysis. Prefer journalctl’s built-in filters over grep where possible since they leverage structured fields and are more reliable.
Filtering by unit, priority, identifier:
# All 'error' and higher priority entries from nginx service
journalctl -u nginx.service -p err

# Kernel messages only
journalctl -k

# Messages from a specific PID (process)
journalctl _PID=1234
Search by text and use -g to highlight matches:
# Grep through journal entries (case-insensitive)
journalctl | grep -i "out of memory"

# Use journalctl's built-in grep-style matching
journalctl -g "OutOfMemory" -o short
Output formats and structured export:
# Send JSON output to jq to inspect fields
journalctl -u docker.service -n 20 -o json | jq '.[0]'

# CSV-like export (quick) - not native, but you can format JSON:
journalctl -o json-pretty -u mysql.service | jq -r '.MESSAGE'
Disk management and log retention:
# Set maximum disk usage for the journal (system-wide via runtime)
sudo journalctl --vacuum-size=500M

# Remove entries older than 2 weeks
sudo journalctl --vacuum-time=2weeks
Advanced techniques:
- Combine filters: journalctl -u httpd.service -p warning --since "1 hour ago"
- Use _COMM, _EXE, SYSLOG_IDENTIFIER fields for finer matching (e.g., _COMM=nginx)
- Export a boot’s logs: journalctl -b -o export > boot.journal and import elsewhere with journalctl --file=boot.journal
Common Pitfalls
Be aware of a few common stumbling blocks when analyzing journals.
Assuming logs persist across reboots:
# Make logs persistent so they survive reboots
sudo mkdir -p /var/log/journal
sudo systemd-tmpfiles --create --prefix /var/log/journal
sudo systemctl restart systemd-journald
Explanation: If /var/log/journal does not exist, the journal may be in volatile storage and cleared on reboot. Enabling persistent storage creates more disk usage — manage it with vacuuming.
Thinking journalctl output equals /var/log/messages:
# Use -o verbose to inspect fields rather than relying on plain MESSAGE
journalctl -n 1 -o verbose
Explanation: The journal is structured; MESSAGE is only one field. Some services log to syslog or rotate logs to files — check /var/log if necessary.
Permission denied when reading the journal:
# If you see "Failed to open journal", try being root or use sudo
sudo journalctl -n 50
Explanation: Reading system logs often requires membership in the "systemd-journal" group or root privileges.
Next Steps
- Automate and alert: integrate journal exports into log collection or monitoring (rsyslog/ELK, systemd-journal-remote, or use fluentd) for long-term analysis and alerting.
Learn structured fields: explore verbose/JSON output to discover fields you can filter on (_SYSTEMD_UNIT, _PID, _COMM, SYSLOG_IDENTIFIER).
journalctl -n 5 -o json-pretty
Practice: run a few investigations on your system — check a service that fails and use journalctl -u--since "1 hour ago".
journalctl -u apache2.service --since "1 hour ago" -n 200
Closing note: journalctl is powerful because it combines structured metadata with flexible querying. Start with the basic viewing commands, then adopt field-based filters and JSON exports for repeatable, precise investigations.
👉 Explore more IT books and guides at dargslan.com.