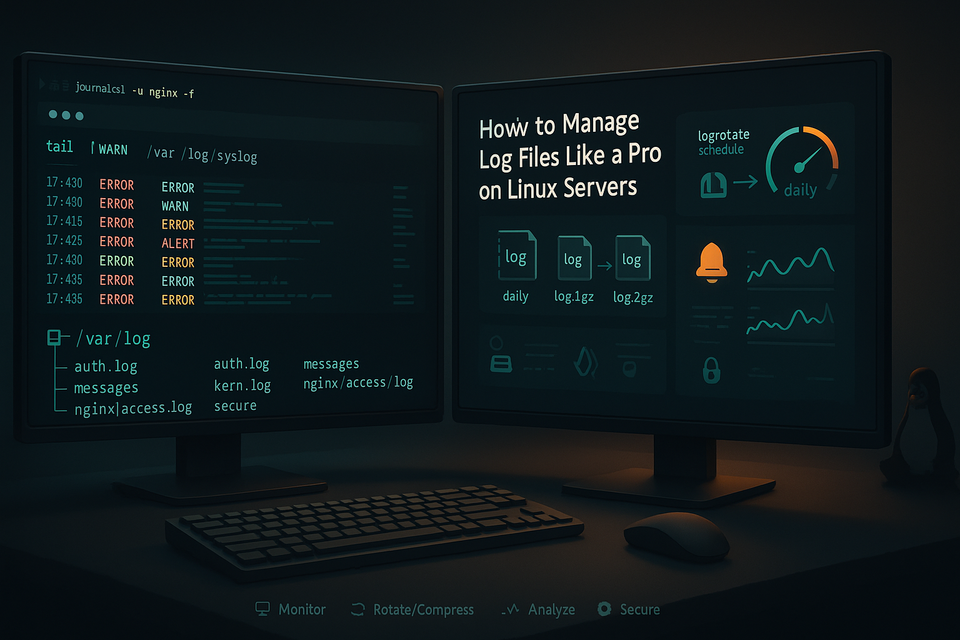
How to Manage Log Files Like a Pro on Linux Servers

Short introduction
Logs are the lifeblood of troubleshooting and auditing on Linux servers. Proper log management saves time, disk space, and helps you spot problems before they become outages. This guide walks through practical techniques to view, rotate, search, and centralize logs like a pro.
Commands quick-reference
| Command | Purpose |
|---|---|
| ls /var/log | List system log files |
| tail -f /var/log/syslog | Stream a log file live |
| journalctl -u nginx.service | View systemd unit logs |
| logrotate /etc/logrotate.conf | Run logrotate manually |
| grep -i "error" /var/log/apache2/error.log | Search for keywords |
| gzip /var/log/old.log | Compress a log file |
| rsyslogd -n | Start rsyslog in foreground (debug) |
| filebeat -e | Run Filebeat in foreground (debug) |
Understand where logs live and how they’re structured
Linux systems place logs in a few predictable locations and formats. Classic syslog-style daemons write to /var/log (files like syslog, auth.log, messages), while systemd’s journal stores structured logs in a binary database accessed by journalctl. Knowing what’s where makes searching and retention policy decisions straightforward.
Example: list common log locations and sizes
# show top log files by size
sudo du -h /var/log/* | sort -hr | head -n 20

# list journal disk usage
sudo journalctl --disk-usage
What to look for:
- /var/log/syslog or /var/log/messages: general system messages.
- /var/log/auth.log or secure: authentication and sudo logs.
- /var/log/*.log for app-specific logs (nginx, apache, mysql).
- journalctl for systemd-managed services and structured metadata (PID, UID, SYSLOG_IDENTIFIER).
Tip: Use ls -l and file to check ownership and rotation patterns. If a log is owned by root but your app runs as www-data, permission issues may hide logs.
Use journalctl and systemd effectively
Systemd’s journal stores logs in binary format, but journalctl provides flexible querying with timestamps, priorities, and unit filtering. It’s often the first tool for recent-service issues.
Basic usage:
# show last 200 lines for a unit
sudo journalctl -u nginx.service -n 200 --no-pager

# follow live output
sudo journalctl -u nginx.service -f

# show only priority warning and above
sudo journalctl -p warning -u nginx.service

# show logs since 2 hours ago
sudo journalctl --since "2 hours ago" -u sshd.service
Advanced filtering:
- Use -o json or -o json-pretty to parse with tools or ship structured logs.
- Filter by _PID, _UID, or _SYSTEMD_UNIT if you need precise correlation.
- Configure persistent storage by creating /var/log/journal and ensuring systemd-journald.conf has Storage=persistent.
Example enabling persistent journal:
sudo mkdir -p /var/log/journal
sudo systemctl restart systemd-journald
Rotate, compress, and purge with logrotate
Old logs can consume all disk space if not handled. logrotate is the standard tool for rotating, compressing, and removing logs automatically. By default it runs daily via cron or systemd timer and reads /etc/logrotate.d and /etc/logrotate.conf.
Sample logrotate configuration (/etc/logrotate.d/myapp):
/var/log/myapp/*.log {
    daily
    rotate 14
    missingok
    compress
    delaycompress
    notifempty
    create 0640 myuser mygroup
    postrotate
        systemctl reload myapp.service >/dev/null 2>&1 || true
    endscript
}
Run logrotate manually for testing:
sudo logrotate -d /etc/logrotate.conf    # debug mode, no changes
sudo logrotate -f /etc/logrotate.conf    # force rotation now
Best practices:
- Use compress + delaycompress to keep the most recent rotated file uncompressed if apps need it.
- Ensure create lines set correct owner/mode after rotation.
- Set rotate N and maxsize to limit disk usage predictably.
Search, parse, and analyze logs efficiently
Searching with grep is fine for quick checks, but combining tail, awk, sed, and specialized analyzers improves throughput. Learn a few patterns to extract timestamps, IPs, and error codes.
Common commands:
# find all error lines in nginx access and error logs
grep -i "error" /var/log/nginx/error.log
grep -i "error" /var/log/nginx/access.log

# tail and filter live
tail -n 200 -f /var/log/nginx/access.log | grep --line-buffered " 500 "

# extract IP and URL from access log using awk
awk '{print $1, $7}' /var/log/nginx/access.log | sort | uniq -c | sort -rn | head -n 20
Use tools:
- goaccess for web log dashboards: goaccess /var/log/nginx/access.log -o report.html
- multitail or lnav for multi-file live viewing with coloring.
- jq + journalctl -o json for structured queries and piping to pipelines or Elasticsearch ingestion.
Example: get JSON from journalctl and extract MESSAGE field
sudo journalctl -u myapp.service -o json | jq -r '.[].MESSAGE'
Centralize logs for long-term analysis and alerts
For multiple servers, centralizing logs helps correlate events and create alerts. Common stacks: rsyslog/syslog-ng -> Elasticsearch/Graylog -> Kibana/Grafana, or lightweight shippers like Filebeat sending directly to Elasticsearch/Logstash.
Simple rsyslog forwarding example (on client):
# /etc/rsyslog.d/50-forward.conf
*.* @@logs.example.com:514    # use @@ for TCP, @ for UDP
Reload rsyslog:
sudo systemctl restart rsyslog
Example Filebeat config snippet to ship files:
filebeat.inputs:
- type: log
  paths:
    - /var/log/nginx/*.log
output.elasticsearch:
  hosts: ["es.example.com:9200"]
Considerations when centralizing:
- Secure transport with TLS and authentication.
- Ensure timestamp synchronization (NTP/chrony).
- Index retention policies and data lifecycle management to control costs.
Common Pitfalls
- Not rotating logs or misconfiguring logrotate: leads to disk full, crashed services, and lost visibility.
- Shipping logs without authentication/encryption: exposes sensitive data and risks tampering.
- Parsing only plain text and ignoring structured logs: you miss fields like trace IDs and metadata that speed root cause analysis.
Next Steps
- Audit: list all log sources on one server and map where each will be retained and for how long.
- Automate: write or update logrotate configs and deploy to similar servers via configuration management.
- Centralize: set up a lightweight central logging pipeline (Filebeat -> Elasticsearch -> Kibana or rsyslog -> Graylog) on a test environment and experiment with alerting.
By following these practices—knowing where logs live, using journalctl, rotating logs with logrotate, searching efficiently, and centralizing when needed—you’ll reduce firefighting time and gain better visibility into your servers.
👉 Explore more IT books and guides at dargslan.com.
