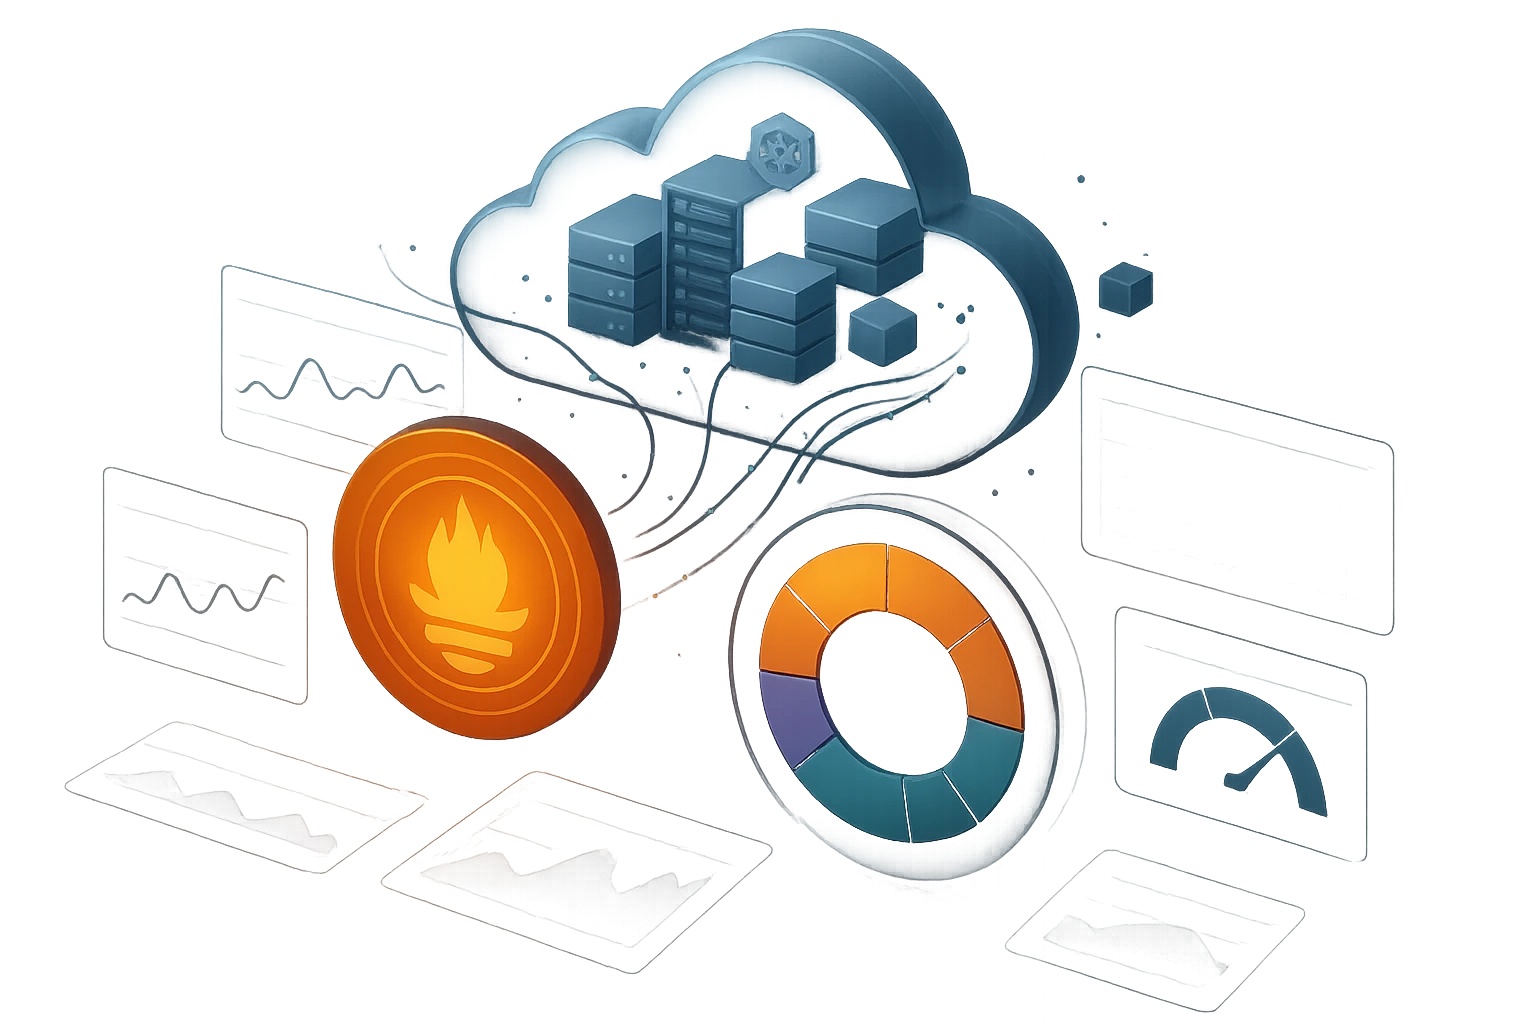
Monitoring Cloud Resources with Prometheus and Grafana
Sponsor message — This article is made possible by Dargslan.com, a publisher of practical, no-fluff IT & developer workbooks.
Why Dargslan.com?
If you prefer doing over endless theory, Dargslan’s titles are built for you. Every workbook focuses on skills you can apply the same day—server hardening, Linux one-liners, PowerShell for admins, Python automation, cloud basics, and more.
In today's digital landscape, where businesses rely heavily on cloud infrastructure to deliver services, maintain operations, and scale dynamically, understanding the health and performance of your systems has become non-negotiable. Organizations face mounting pressure to ensure uptime, optimize resource utilization, and respond to incidents before they cascade into critical failures. The visibility gap between what's happening in your infrastructure and what you know about it can mean the difference between seamless operations and costly downtime that damages both revenue and reputation.
Cloud resource monitoring encompasses the systematic observation, measurement, and analysis of infrastructure components, applications, and services running in cloud environments. This practice involves collecting metrics, logs, and traces to gain comprehensive insights into system behavior, performance patterns, and potential issues. Through effective monitoring strategies, teams can make data-driven decisions, implement proactive maintenance, and establish reliable service delivery that meets both business objectives and user expectations.
Throughout this exploration, you'll discover how two powerful open-source tools—Prometheus for metrics collection and Grafana for visualization—work together to create a robust monitoring ecosystem. We'll examine practical implementation strategies, architectural considerations, best practices for metric collection, and visualization techniques that transform raw data into actionable intelligence. Whether you're managing a small application or orchestrating complex microservices architectures, you'll gain concrete knowledge to build monitoring solutions that scale with your needs.
Understanding the Monitoring Foundation
Before diving into implementation details, establishing a solid conceptual foundation proves essential for building effective monitoring systems. The monitoring landscape has evolved significantly from traditional server-based approaches to accommodate cloud-native architectures with their ephemeral nature, dynamic scaling, and distributed components.
The Evolution of Infrastructure Monitoring
Traditional monitoring systems were designed for static environments where servers had permanent addresses, predictable lifecycles, and stable configurations. These legacy approaches relied heavily on agent-based polling, manual configuration, and centralized collection points. However, cloud environments introduced fundamental shifts: instances appear and disappear within minutes, containers orchestrate workloads across clusters, and microservices communicate through complex service meshes.
Modern monitoring must embrace these dynamics through service discovery mechanisms, pull-based metrics collection, and dimensional data models that capture the multi-faceted nature of cloud resources. The shift from monitoring individual machines to observing distributed systems requires different mental models and tooling approaches.
"The transition from asking 'is the server up?' to 'is the service delivering value to users?' represents a fundamental shift in how we approach system reliability."
Key Monitoring Concepts
Several core concepts underpin effective cloud monitoring strategies. Metrics represent numerical measurements taken at regular intervals, such as CPU utilization, request latency, or error rates. These time-series data points form the backbone of performance analysis and alerting systems.
Cardinality refers to the number of unique combinations of label values in your metrics. High cardinality can significantly impact storage requirements and query performance, making thoughtful label design crucial for scalable monitoring systems.
Observability extends beyond traditional monitoring by emphasizing the ability to understand system behavior from external outputs. This encompasses metrics, logs, and distributed traces working together to provide comprehensive visibility into complex systems.
| Monitoring Aspect | Traditional Approach | Cloud-Native Approach | Key Difference |
|---|---|---|---|
| Service Discovery | Static configuration files | Dynamic discovery via APIs | Automatic adaptation to infrastructure changes |
| Data Collection | Push-based agents | Pull-based scraping | Simplified network topology and failure handling |
| Metric Model | Hierarchical naming | Dimensional labels | Flexible querying and aggregation capabilities |
| Scaling Strategy | Vertical scaling of collectors | Horizontal federation and sharding | Linear scalability with infrastructure growth |
| Alert Philosophy | Threshold-based on individual hosts | Service-level objectives and error budgets | Focus on user impact rather than component status |
Why Prometheus and Grafana
Among the numerous monitoring solutions available, Prometheus and Grafana have emerged as the de facto standard for cloud-native monitoring. Their widespread adoption stems from several compelling advantages that align perfectly with modern infrastructure requirements.
Prometheus excels at time-series data collection and storage, offering a powerful query language, efficient storage engine, and built-in alerting capabilities. Its pull-based model fits naturally with dynamic cloud environments, while the dimensional data model enables flexible analysis across multiple dimensions simultaneously.
Grafana complements Prometheus by providing sophisticated visualization capabilities that transform metrics into intuitive dashboards. Its support for multiple data sources, extensive plugin ecosystem, and collaborative features make it ideal for teams needing to share insights across organizational boundaries.
- Open-source foundation: Both tools benefit from active communities, extensive documentation, and freedom from vendor lock-in
- Cloud-native design: Built specifically for containerized and microservices architectures
- Scalability patterns: Well-established approaches for handling enterprise-scale deployments
- Integration ecosystem: Extensive exporters and plugins for virtually any technology stack
- Industry adoption: Proven in production at organizations ranging from startups to Fortune 500 companies
Architecting Your Monitoring Stack
Designing a monitoring architecture requires careful consideration of data flow, storage requirements, high availability, and operational complexity. The decisions made during this phase significantly impact system reliability, query performance, and long-term maintainability.
Core Components and Data Flow
A typical Prometheus-based monitoring stack consists of several interconnected components, each serving specific purposes within the data pipeline. Understanding how these elements interact helps in making informed architectural decisions.
Prometheus servers form the heart of the system, periodically scraping metrics from configured targets, storing the data locally, and evaluating alerting rules. Each Prometheus instance operates independently, making horizontal scaling straightforward through federation or sharding strategies.
Exporters bridge the gap between systems that don't natively expose Prometheus metrics and your monitoring infrastructure. These specialized applications translate various data formats and protocols into Prometheus-compatible metrics endpoints. The ecosystem includes exporters for databases, message queues, cloud provider APIs, and countless other services.
Service discovery mechanisms automatically identify monitoring targets as your infrastructure evolves. Whether using Kubernetes API integration, cloud provider service discovery, or file-based configurations, this component eliminates manual target management in dynamic environments.
"The elegance of pull-based monitoring lies in its simplicity: the monitoring system decides when to collect data, eliminating the need for targets to understand complex push protocols or maintain persistent connections."
Storage Considerations
Prometheus stores metrics in a local time-series database optimized for write-heavy workloads and efficient range queries. The storage layer uses a custom format that compresses data effectively while maintaining fast query performance. However, this local-first approach requires thoughtful planning around retention, capacity, and durability.
By default, Prometheus retains metrics for 15 days, though this can be adjusted based on storage capacity and retention requirements. For longer-term storage, organizations typically implement remote storage solutions that integrate with Prometheus through its remote write and read APIs.
🔍 Retention strategy: Balance storage costs against the need for historical analysis and capacity planning
📊 Downsampling: Reduce storage requirements by aggregating older data into lower-resolution samples
💾 Remote storage: Offload long-term metrics to specialized time-series databases like Thanos, Cortex, or cloud-managed solutions
High Availability Patterns
Ensuring monitoring system reliability presents an interesting challenge: how do you monitor the monitors? High availability for Prometheus typically involves running multiple identical instances that scrape the same targets independently. While this creates data duplication, it provides resilience against individual instance failures.
Grafana achieves high availability through traditional stateless application patterns. Multiple Grafana instances connect to a shared database for dashboard storage and session management. Load balancers distribute user requests across instances, providing both availability and horizontal scaling for user traffic.
For alerting, running multiple Prometheus instances requires coordination to prevent duplicate notifications. The Alertmanager component handles this through clustering and deduplication, ensuring alerts fire reliably without overwhelming on-call teams with redundant notifications.
| Component | HA Approach | Considerations | Trade-offs |
|---|---|---|---|
| Prometheus Server | Multiple identical instances | Increased scrape load on targets; storage duplication | Simple implementation vs. resource overhead |
| Grafana | Stateless replicas with shared database | Database becomes single point of failure | Easy scaling vs. database reliability dependency |
| Alertmanager | Clustered instances with gossip protocol | Network partition handling; state synchronization | Deduplication reliability vs. configuration complexity |
| Exporters | Typically run alongside monitored services | Failure domains align with application failures | Simplified deployment vs. monitoring during outages |
Security and Access Control
Monitoring systems inherently access sensitive information about infrastructure, application behavior, and business metrics. Implementing proper security controls protects this data while enabling necessary access for operational teams.
Prometheus itself provides basic authentication and TLS support for securing metrics endpoints. However, many organizations deploy it behind reverse proxies or service meshes that handle authentication, authorization, and encryption. This approach centralizes security policies and integrates with existing identity management systems.
Grafana offers more sophisticated access controls through its organization and team features. Role-based permissions determine who can view, edit, or administer dashboards and data sources. Integration with enterprise authentication providers like LDAP, OAuth, or SAML enables centralized user management and single sign-on experiences.
"Security in monitoring isn't just about protecting the system itself—it's about safeguarding the operational intelligence that could reveal vulnerabilities, business metrics, or architectural details to unauthorized parties."
Implementing Prometheus for Metrics Collection
Moving from architectural planning to practical implementation requires understanding Prometheus configuration, metric types, and collection strategies. These technical details determine how effectively your monitoring system captures the signals that matter for your specific use cases.
Configuration and Service Discovery
Prometheus configuration centers around the prometheus.yml file, which defines scrape targets, intervals, and various operational parameters. The configuration uses YAML syntax and supports dynamic reloading without service restarts, enabling iterative refinement of monitoring coverage.
Service discovery configurations replace static target lists with dynamic mechanisms that automatically discover scraping endpoints. For Kubernetes environments, the kubernetes_sd_config discovers pods, services, and nodes through the Kubernetes API. Cloud providers offer similar discovery mechanisms through their respective APIs.
⚙️ Scrape intervals: Balance data granularity against storage requirements and target load
🎯 Target relabeling: Transform discovered targets before scraping to filter, enrich, or modify metadata
🏷️ Metric relabeling: Modify or drop metrics after collection to reduce cardinality or standardize labels
Understanding Metric Types
Prometheus defines four fundamental metric types, each suited to different measurement scenarios. Choosing the appropriate type ensures accurate data collection and meaningful aggregations.
Counters represent cumulative values that only increase over time, such as request counts or error tallies. These metrics reset to zero when processes restart, making them ideal for calculating rates of change rather than absolute values. The rate() and increase() functions extract meaningful insights from counter metrics.
Gauges measure values that can increase or decrease arbitrarily, like memory usage, queue depths, or concurrent connections. Unlike counters, gauges represent instantaneous measurements where the current value holds meaning independent of historical values.
Histograms sample observations and count them in configurable buckets, enabling calculation of quantiles and distributions. These metrics excel at measuring request durations, response sizes, or any value where understanding the distribution matters more than simple averages. Histograms generate multiple time series per metric, with each bucket creating a separate series.
Summaries provide similar functionality to histograms but calculate quantiles on the client side. While this reduces query-time computation, it prevents aggregation across instances and requires predefined quantiles at instrumentation time.
"The choice between histograms and summaries often comes down to whether you need to aggregate across multiple instances—histograms support this through bucket aggregation, while summaries calculate quantiles per instance."
Instrumentation Best Practices
Effective instrumentation strikes a balance between comprehensive coverage and manageable cardinality. Over-instrumentation creates storage and performance problems, while under-instrumentation leaves blind spots that hide critical issues.
Focus instrumentation on service-level indicators that directly relate to user experience: request rates, error rates, and latency distributions. These signals enable calculation of service level objectives and inform capacity planning decisions. Supplement these with resource utilization metrics that help diagnose performance problems and optimize efficiency.
Label design significantly impacts both query flexibility and system performance. Labels enable multi-dimensional analysis but each unique combination of label values creates a new time series. Keep label cardinality bounded by avoiding user IDs, timestamps, or other high-cardinality values as label values. Instead, use labels for dimensions like service names, environments, regions, or HTTP status code classes.
- Naming conventions: Use consistent metric naming that includes the unit of measurement and follows Prometheus conventions
- Label consistency: Apply the same label names across related metrics to enable correlation and aggregation
- Cardinality monitoring: Track the number of time series per metric to detect cardinality explosions early
- Documentation: Include metric descriptions and type information using Prometheus comment syntax
- Testing: Validate instrumentation in development environments before deploying to production
Exporters and Integration Patterns
While modern applications increasingly expose native Prometheus endpoints, legacy systems and third-party services often require exporters to bridge the gap. The Prometheus ecosystem includes hundreds of officially supported and community-maintained exporters for various technologies.
The Node Exporter provides comprehensive host-level metrics including CPU, memory, disk, and network statistics. Deploying it on every host in your infrastructure establishes baseline visibility into resource utilization and system health.
Database exporters translate database-specific metrics into Prometheus format. The MySQL Exporter, PostgreSQL Exporter, and similar tools expose query performance, connection pool statistics, and replication lag metrics essential for database reliability.
Cloud provider exporters poll cloud APIs to collect metrics about managed services. These exporters enable monitoring of services like load balancers, object storage, and managed databases that don't provide direct metrics endpoints.
When existing exporters don't meet your needs, creating custom exporters using client libraries proves straightforward. Prometheus provides official client libraries for Go, Python, Java, and Ruby, with community libraries covering most other languages. Custom exporters follow simple patterns: expose an HTTP endpoint, calculate metrics on demand, and return them in Prometheus text format.
Building Effective Dashboards with Grafana
Raw metrics hold limited value until transformed into visualizations that communicate insights clearly and enable rapid decision-making. Grafana excels at this transformation, offering powerful tools for creating dashboards that serve diverse audiences from operations teams to executive stakeholders.
Dashboard Design Principles
Effective dashboards communicate information hierarchically, guiding viewers from high-level health indicators to detailed diagnostic views. The top of each dashboard should answer the fundamental question: "Is everything working correctly?" Subsequent panels provide progressively more detailed information for investigation and troubleshooting.
Information density requires careful balance. Sparse dashboards waste screen real estate and force excessive scrolling, while overcrowded layouts overwhelm viewers and obscure important signals. Group related metrics together, use consistent panel sizes, and leverage Grafana's row features to organize content logically.
Color usage should convey meaning rather than decoration. Reserve red for critical issues, yellow for warnings, and green for healthy states. Maintain consistency across dashboards so teams develop intuitive understanding of what colors signify. Consider color-blind friendly palettes to ensure accessibility.
"The best dashboards answer questions before they're asked, revealing both current state and recent trends that provide context for understanding whether observed behavior is normal or requires attention."
Visualization Types and When to Use Them
Grafana supports numerous visualization types, each suited to particular data patterns and communication goals. Selecting appropriate visualizations ensures dashboards communicate effectively without requiring extensive interpretation.
🎯 Time series graphs: The workhorse of monitoring dashboards, ideal for showing metric trends over time and comparing multiple series
📊 Bar gauges: Excellent for displaying current values with context about normal ranges or capacity limits
🔢 Stat panels: Highlight single values with optional sparklines showing recent trends
🗺️ Heatmaps: Reveal distribution patterns in latency, request sizes, or other bucketed metrics
📋 Tables: Present detailed information when multiple dimensions need simultaneous display
Query Optimization Techniques
Dashboard performance directly impacts usability. Slow-loading dashboards frustrate users and discourage regular monitoring. Optimizing Prometheus queries ensures responsive dashboards even when displaying extensive time ranges or high-cardinality metrics.
Use recording rules to precompute expensive queries. These rules run at regular intervals, storing results as new time series that dashboards can query efficiently. Recording rules work particularly well for complex aggregations, multi-step calculations, or queries that combine many time series.
Limit time ranges to what's actually needed for each panel. Displaying the last 24 hours of data requires far less computation than showing the previous month. Use dashboard variables to let users adjust time ranges when they need historical context without forcing all panels to query extended periods by default.
Apply appropriate aggregation intervals using the $__interval variable. This Grafana-provided variable automatically adjusts based on the displayed time range, ensuring queries return reasonable numbers of data points without overwhelming the rendering engine or obscuring trends.
Template Variables and Dynamic Dashboards
Template variables transform static dashboards into flexible tools that adapt to different contexts. These variables enable filtering by environment, service, region, or any dimension captured in metric labels, allowing a single dashboard to serve multiple teams or use cases.
Query-based variables populate dropdown menus by executing Prometheus queries that return label values. For example, a variable querying for unique service names enables filtering all dashboard panels to show metrics for a specific service. Chaining variables creates hierarchical filters, such as selecting a region first, then choosing from services deployed in that region.
Variable interpolation inserts selected values into panel queries using the $variable_name syntax. This mechanism enables powerful filtering without duplicating dashboard panels for each possible combination of dimensions. Multi-value variables allow selecting multiple options simultaneously, with queries automatically handling the OR logic.
Alerting and Annotations
While Prometheus handles most alerting responsibilities, Grafana provides complementary alerting capabilities and powerful annotation features that enrich dashboard context. Grafana alerts work particularly well for queries that span multiple data sources or require complex transformations not easily expressed in Prometheus alerting rules.
Annotations mark specific time points or ranges on graphs, providing context about deployments, incidents, or configuration changes. Automatic annotations query data sources for events, while manual annotations let teams document significant occurrences directly on dashboards. These markers help correlate metric changes with operational activities, accelerating troubleshooting and post-incident analysis.
Alert notification channels integrate with communication platforms like Slack, PagerDuty, or email systems. Configuring appropriate channels ensures alerts reach the right people through their preferred communication methods. Alert rules support templating for customized messages that include metric values, dashboard links, and contextual information.
Advanced Monitoring Patterns
As monitoring maturity increases, teams often need to address sophisticated scenarios that go beyond basic metrics collection and visualization. These advanced patterns enable handling scale challenges, implementing SLO-based monitoring, and extracting deeper insights from telemetry data.
Federation and Hierarchical Architectures
Single Prometheus instances handle impressive scale, but organizations with extensive infrastructure or global presence eventually need hierarchical monitoring architectures. Federation allows one Prometheus server to scrape selected time series from other Prometheus servers, creating aggregation layers that consolidate metrics across regions, environments, or organizational boundaries.
A typical federated setup deploys Prometheus instances close to monitored workloads, minimizing network latency and creating failure domain isolation. Higher-level Prometheus servers then federate key metrics from these edge instances, providing centralized visibility without overwhelming any single system. This pattern supports both geographic distribution and organizational separation while maintaining unified visibility where needed.
Recording rules at federation boundaries reduce data volume by pre-aggregating metrics before transferring them between layers. Instead of federating raw metrics with high cardinality, compute aggregated values that answer specific questions at the global level. This approach balances comprehensive local visibility with manageable central storage requirements.
"Federation transforms monitoring from a centralized bottleneck into a distributed system that mirrors the architecture of the infrastructure it observes, scaling naturally as your environment grows."
Service Level Objectives and Error Budgets
SLO-based monitoring shifts focus from component availability to user-perceived reliability. Rather than alerting on individual server failures, SLO monitoring measures whether the overall service meets defined reliability targets from the user's perspective.
Implementing SLO monitoring starts with defining service level indicators—quantifiable measures of service quality like request success rate, latency percentiles, or data freshness. These SLIs should directly correlate with user experience rather than infrastructure state.
Service level objectives establish targets for SLIs, such as "99.9% of requests succeed" or "95% of requests complete within 200ms." These objectives set clear expectations and enable calculation of error budgets—the acceptable amount of unreliability within a given time window.
Error budget tracking provides a data-driven approach to balancing reliability and feature velocity. When services consume their error budget quickly, teams prioritize reliability improvements. When substantial budget remains, teams can confidently pursue feature development or accept risks from experimental changes.
- SLI selection: Choose metrics that matter to users, not just what's easy to measure
- Realistic targets: Set objectives based on actual user needs and system capabilities
- Multi-window alerting: Alert on both short-term incidents and long-term trends in SLO compliance
- Burn rate analysis: Calculate how quickly error budgets deplete to enable proactive intervention
- Regular review: Adjust SLOs as systems evolve and user expectations change
Multi-Cluster and Multi-Cloud Monitoring
Organizations operating across multiple Kubernetes clusters or cloud providers face unique monitoring challenges. Each environment may have distinct networking constraints, service discovery mechanisms, and operational characteristics that complicate unified visibility.
Prometheus deployments in multi-cluster environments typically follow one of two patterns: centralized scraping or local collection with central aggregation. Centralized scraping deploys Prometheus instances that reach across cluster boundaries to scrape targets directly. This approach works well when network connectivity permits and target counts remain manageable.
Local collection deploys Prometheus within each cluster, leveraging cluster-local service discovery and minimizing cross-cluster traffic. Central aggregation then occurs through federation, remote write, or query federation tools like Thanos. This pattern provides better isolation and scales more effectively for large deployments.
Grafana's multi-data-source capabilities shine in multi-cluster scenarios. A single dashboard can query multiple Prometheus instances, presenting unified views across environments. Template variables enable switching between clusters or displaying aggregated metrics across all clusters simultaneously.
Correlation with Logs and Traces
Metrics provide excellent visibility into system behavior patterns but often lack the detailed context needed for root cause analysis. Integrating metrics with logs and distributed traces creates comprehensive observability that accelerates troubleshooting and deepens system understanding.
Grafana's Explore interface facilitates correlation by allowing seamless pivoting between metrics, logs, and traces. When investigating a latency spike in metrics, clicking through to relevant logs reveals error messages or unusual events. From logs, jumping to distributed traces shows the complete request path through microservices architecture.
Implementing effective correlation requires consistent labeling across telemetry types. Service names, request IDs, and other identifying information should use identical label names in metrics, log lines, and trace spans. This consistency enables automatic correlation and reduces friction when moving between different telemetry types during investigations.
Tools like Loki for logs and Tempo for traces integrate naturally with Prometheus and Grafana, forming a complete observability stack from the same vendor ecosystem. This integration provides unified configuration, consistent query languages, and seamless navigation between telemetry types.
Operational Considerations and Maintenance
Deploying monitoring infrastructure represents just the beginning of the journey. Ongoing operational excellence requires attention to capacity planning, performance optimization, upgrade management, and continuous improvement of monitoring coverage and alert quality.
Capacity Planning and Resource Management
Prometheus resource consumption correlates primarily with the number of active time series and the query load. Each time series requires memory for indexing and disk space for sample storage. Understanding these relationships enables accurate capacity planning and cost optimization.
Monitor your monitoring system by instrumenting Prometheus itself. Key metrics include prometheus_tsdb_head_series for active time series count, prometheus_tsdb_head_chunks for memory usage indicators, and query duration percentiles. These metrics provide early warning when capacity limits approach.
Cardinality explosions represent the most common cause of unexpected resource consumption. A single metric with unbounded label values can generate millions of time series, overwhelming storage and memory. Implement cardinality limits using metric relabeling to drop problematic labels or entire metrics before they impact system stability.
"Effective capacity planning for monitoring systems requires treating them as production infrastructure deserving the same attention to reliability, performance, and resource efficiency as the applications they observe."
Backup and Disaster Recovery
While metrics represent operational data rather than critical business records, losing monitoring history complicates incident response, capacity planning, and performance analysis. Implementing backup strategies protects against data loss while balancing storage costs.
Prometheus snapshots provide point-in-time backups of the time-series database. Creating snapshots through the API generates consistent copies suitable for backup to object storage or other durable storage systems. Automated snapshot creation on regular schedules ensures recent data remains recoverable.
Remote write configurations continuously stream metrics to external storage systems, providing real-time backup and enabling long-term retention without local storage constraints. Solutions like Thanos, Cortex, or cloud-managed services accept remote write data and offer queryable storage spanning months or years.
Grafana dashboard backups preserve visualization configurations and organizational knowledge. Exporting dashboards as JSON files enables version control, disaster recovery, and sharing across environments. Many organizations store dashboard definitions in Git repositories, treating them as infrastructure-as-code.
Alert Fatigue and Tuning
Poorly configured alerts undermine monitoring effectiveness by overwhelming teams with notifications about non-issues while potentially missing genuine problems. Alert tuning represents an ongoing process of refinement based on operational experience and changing system characteristics.
Start with conservative alert thresholds that fire only for clear problems requiring immediate attention. Gradually expand alert coverage as you understand normal system behavior and develop confidence in alert accuracy. This approach prevents alert fatigue while building trust in the monitoring system.
Implement alert grouping to prevent notification storms when multiple related components fail simultaneously. Grouping alerts by service, cluster, or failure domain ensures teams receive manageable notification volumes even during widespread incidents.
Use alert inhibition to suppress downstream alerts when root cause alerts fire. If a database failure causes application errors, suppress application alerts while the database alert remains active. This technique reduces noise and helps teams focus on actual root causes.
Regular alert review meetings examine which alerts fired, whether they indicated real problems, and whether responses proved appropriate. This feedback loop drives continuous improvement in alert quality and helps teams develop intuition about system behavior.
Upgrade Strategies and Version Management
Both Prometheus and Grafana release new versions regularly, introducing features, performance improvements, and security fixes. Maintaining current versions requires balancing the benefits of new capabilities against the risks and effort of upgrades.
Test upgrades in non-production environments first, validating that existing queries, dashboards, and alerts continue functioning correctly. Breaking changes occasionally occur between versions, particularly in major releases. Review release notes carefully and plan for configuration adjustments when necessary.
Rolling upgrades minimize downtime for high-availability deployments. Upgrade Prometheus instances one at a time, allowing each to stabilize before proceeding to the next. Grafana's stateless nature enables even simpler rolling upgrades through standard container orchestration practices.
Maintain version consistency across components when possible. Using the Prometheus operator for Kubernetes deployments simplifies version management by coordinating upgrades across Prometheus, Alertmanager, and related components. This approach reduces compatibility concerns and ensures consistent feature availability.
Security Hardening and Compliance
Monitoring systems access sensitive infrastructure details and business metrics, making them attractive targets for attackers and important considerations for compliance frameworks. Implementing comprehensive security controls protects both the monitoring system and the information it collects.
Authentication and Authorization
Securing access to monitoring systems prevents unauthorized viewing of operational data and protects against malicious configuration changes. Multi-layered authentication and fine-grained authorization ensure only appropriate personnel access specific monitoring capabilities.
Grafana's authentication options range from basic username/password combinations to enterprise single sign-on through LDAP, OAuth, or SAML. Integration with existing identity providers centralizes user management and enables consistent access policies across organizational tools.
Role-based access control within Grafana defines what users can view and modify. Viewer roles allow read-only access to dashboards, while editor roles permit dashboard creation and modification. Admin roles control data source configuration, user management, and system settings. Organization and team features enable multi-tenant deployments with appropriate isolation.
Prometheus itself provides basic authentication support but typically relies on reverse proxies or service meshes for sophisticated access control. Deploying authentication proxies in front of Prometheus endpoints enables integration with enterprise authentication systems while maintaining Prometheus's simplicity.
Network Security and Encryption
Encrypting data in transit prevents eavesdropping on metrics that might reveal architectural details, performance characteristics, or business information. TLS encryption for all monitoring traffic should be standard practice, particularly when monitoring spans multiple networks or cloud providers.
Configure Prometheus to scrape targets over HTTPS when possible, validating certificates to prevent man-in-the-middle attacks. For internal services where certificate management proves challenging, consider service mesh solutions that handle mTLS automatically.
Grafana supports TLS for both user-facing connections and backend communication with data sources. Enabling TLS prevents credential interception and protects dashboard data from network-level observation. Certificate management automation through tools like cert-manager reduces operational overhead for maintaining valid certificates.
Network segmentation limits blast radius if monitoring components become compromised. Deploy Prometheus in dedicated network segments with firewall rules restricting access to only necessary ports and source networks. This defense-in-depth approach contains potential breaches and complicates lateral movement for attackers.
Audit Logging and Compliance
Many regulatory frameworks require audit trails showing who accessed what information and when. Monitoring systems must support these requirements while maintaining operational efficiency and user experience.
Grafana's audit logging captures user actions including dashboard views, edits, and data source queries. Exporting these logs to centralized logging systems enables long-term retention, correlation with other security events, and compliance reporting. Configure appropriate retention periods based on regulatory requirements and organizational policies.
Implement least-privilege principles by granting users only the minimum access necessary for their roles. Regular access reviews identify and remove unnecessary permissions, reducing the risk of insider threats and limiting damage from compromised credentials.
Document monitoring system configurations, access policies, and operational procedures. This documentation supports compliance audits, facilitates knowledge transfer, and enables consistent security practices across teams and environments.
"Security in monitoring systems isn't about preventing observation—it's about ensuring only authorized individuals observe appropriate systems while maintaining comprehensive audit trails of all access."
Cost Optimization Strategies
While Prometheus and Grafana themselves are free open-source software, operating monitoring infrastructure incurs costs for compute resources, storage, network bandwidth, and operational overhead. Strategic optimization reduces these costs without compromising monitoring effectiveness.
Storage Efficiency
Time-series data storage represents the primary cost driver for monitoring systems. Optimizing storage efficiency extends retention periods, reduces infrastructure costs, and improves query performance through smaller data volumes.
Aggressive cardinality management prevents unnecessary time series creation. Review metrics regularly to identify high-cardinality labels that provide limited value. Drop or aggregate these dimensions using relabeling rules before data enters storage.
Retention policies should align with actual analysis needs rather than arbitrary durations. If teams rarely query data older than 30 days, reducing retention from 90 days to 45 days significantly cuts storage requirements without impacting most use cases. Supplement shorter local retention with remote storage for occasional historical analysis.
Compression settings affect the balance between storage space and CPU utilization. Prometheus's default compression provides good efficiency, but tuning based on specific workload characteristics can yield additional savings. Monitor compression ratios to ensure storage efficiency remains healthy.
Query Optimization
Inefficient queries consume unnecessary CPU resources and slow dashboard loading. Optimizing query patterns reduces infrastructure requirements while improving user experience.
Use recording rules to precompute complex aggregations rather than calculating them on every dashboard load. Recording rules trade modest storage increases for substantial query performance improvements, particularly for dashboards viewed frequently or by many users.
Limit query time ranges to what's actually necessary. Queries spanning months of data when users only need recent trends waste resources and slow rendering. Use dashboard time range controls and $__range variable to scope queries appropriately.
Avoid high-cardinality aggregations that process millions of time series. If a query performs poorly, consider whether recording rules, metric redesign, or different visualization approaches might achieve the same goal more efficiently.
Infrastructure Right-Sizing
Matching infrastructure resources to actual monitoring requirements prevents overprovisioning while ensuring adequate capacity for growth. Regular capacity reviews identify optimization opportunities as workloads evolve.
Prometheus memory requirements correlate strongly with active time series count. Calculate expected memory needs based on time series counts and scrape intervals, then provision accordingly with appropriate headroom for growth. Oversized instances waste resources, while undersized instances cause performance problems and potential data loss.
Grafana's resource needs depend primarily on concurrent user counts and query complexity. Start with modest resources and scale based on observed utilization patterns. Horizontal scaling through multiple instances proves more cost-effective than vertical scaling for handling increased user load.
Consider managed services for components where operational overhead exceeds infrastructure costs. Cloud-managed Prometheus or Grafana services eliminate operational burden, provide automatic scaling, and often prove cost-effective when factoring in engineering time.
Troubleshooting Common Issues
Even well-designed monitoring systems encounter problems. Understanding common failure modes and their solutions accelerates recovery and builds operational expertise.
Metrics Not Appearing
When expected metrics don't appear in Prometheus, systematic troubleshooting isolates the problem quickly. Start by verifying targets appear in the Prometheus UI under Status > Targets. If targets show as down, investigate network connectivity, authentication, or target health.
For targets showing as up but missing specific metrics, examine the raw metrics endpoint directly using curl or a browser. This reveals whether the problem lies in metric generation or Prometheus collection. Check relabeling rules that might drop metrics unintentionally.
Scrape timeout issues occur when targets respond slowly, causing Prometheus to abandon collection before receiving all metrics. Increase scrape timeouts or optimize target metric generation to complete within timeout windows.
High Cardinality Problems
Cardinality explosions manifest as rapidly growing memory usage, slow queries, and potential Prometheus crashes. Identifying problematic metrics requires examining the metrics with the most time series using queries like topk(10, count by (__name__)({__name__=~".+"})).
Once identified, address high-cardinality metrics through relabeling rules that drop problematic labels, aggregate values into bounded sets, or remove the metrics entirely if they provide limited value. Implement cardinality limits to prevent future explosions from similar issues.
Dashboard Performance Issues
Slow-loading Grafana dashboards frustrate users and discourage monitoring adoption. Profile slow dashboards by examining query execution times in the panel inspector. Focus optimization efforts on the slowest queries first for maximum impact.
Common performance problems include overly broad time ranges, missing recording rules for complex calculations, and high-cardinality aggregations. Address these through appropriate query scoping, recording rule implementation, and metric design improvements.
Browser performance sometimes limits dashboard responsiveness, particularly for dashboards with many panels or long time ranges. Reduce panel counts, implement row folding for less-critical sections, or split complex dashboards into multiple focused views.
Alert Reliability
Alerts that fail to fire during incidents or generate false positives undermine confidence in monitoring systems. Review alert rules using Prometheus's built-in testing capabilities and examine alert evaluation history to understand firing behavior.
For alerts that don't fire when expected, verify the underlying metrics exist and contain expected values. Check alert rule expressions for logical errors and ensure evaluation intervals align with problem detection requirements.
False positive alerts often stem from overly sensitive thresholds or failure to account for normal system behavior patterns. Adjust thresholds based on historical data, implement alert dampening through for clauses, and consider using anomaly detection approaches for metrics with complex patterns.
Future Trends and Evolution
The monitoring landscape continues evolving rapidly, driven by changing infrastructure patterns, scale requirements, and operational practices. Understanding emerging trends helps organizations prepare for future monitoring needs and evaluate new tools and approaches.
OpenTelemetry Integration
OpenTelemetry represents a convergence of metrics, logs, and traces into a unified observability framework. This CNCF project provides vendor-neutral instrumentation libraries, collection pipelines, and data formats that work across multiple backend systems including Prometheus and Grafana.
Adopting OpenTelemetry enables consistent instrumentation across polyglot environments, reduces vendor lock-in, and simplifies correlation between telemetry types. The OpenTelemetry Collector can receive, process, and export telemetry data to multiple destinations, providing flexibility in backend selection without changing application instrumentation.
eBPF-Based Monitoring
Extended Berkeley Packet Filter (eBPF) technology enables deep system observability without modifying applications or deploying traditional agents. eBPF programs run safely in the kernel, capturing detailed information about system calls, network traffic, and application behavior with minimal overhead.
eBPF-based monitoring tools provide visibility into black-box applications, legacy systems, and components where traditional instrumentation proves difficult. This technology complements rather than replaces existing monitoring, filling gaps in observability coverage.
AI and Machine Learning
Machine learning applications in monitoring range from anomaly detection to automated root cause analysis. These techniques help manage the complexity of modern systems by identifying unusual patterns, predicting capacity needs, and correlating events across vast telemetry datasets.
Anomaly detection algorithms learn normal system behavior patterns and alert when metrics deviate significantly. This approach works particularly well for metrics with complex seasonal patterns or gradual trends that make static threshold alerting impractical.
Automated root cause analysis uses ML to correlate metrics, logs, and traces, suggesting likely causes for observed problems. While these systems don't replace human expertise, they accelerate investigation by highlighting relevant information and potential relationships.
Frequently Asked Questions
How much does it cost to run Prometheus and Grafana in production?
Both tools are open-source and free to use, but operational costs depend on infrastructure scale and deployment choices. A small deployment monitoring a few dozen services might run on a single modest server costing $50-100 monthly. Large-scale deployments monitoring thousands of services across multiple clusters could require dedicated infrastructure costing thousands monthly. Managed service options exist that trade higher per-unit costs for reduced operational overhead, with pricing typically based on metrics volume and retention period.
Can Prometheus handle millions of time series?
Yes, properly configured Prometheus instances handle millions of active time series. A single instance with adequate resources (32GB+ RAM, fast SSD storage) can manage 10+ million time series. Beyond that scale, federation, sharding, or remote storage solutions like Thanos or Cortex enable horizontal scaling to billions of time series. The key is managing cardinality through thoughtful metric design and appropriate aggregation strategies.
How do I migrate from other monitoring tools to Prometheus and Grafana?
Migration typically follows a phased approach: first, deploy Prometheus alongside existing monitoring to validate coverage and build confidence. Create Grafana dashboards that replicate critical views from legacy systems. Gradually shift alerting to Prometheus as teams gain familiarity. Run systems in parallel during transition periods to ensure no monitoring gaps. Complete migration by decommissioning legacy systems once teams fully trust the new stack. This process typically spans several months for large environments.
What's the difference between Prometheus and commercial monitoring solutions?
Prometheus offers powerful capabilities without licensing costs or vendor lock-in, but requires more operational expertise to deploy and maintain. Commercial solutions often provide managed services, enterprise support, and additional features like advanced analytics or compliance reporting. The choice depends on organizational priorities: teams with strong operational capabilities often prefer Prometheus's flexibility and cost structure, while organizations prioritizing reduced operational burden might choose commercial alternatives despite higher costs.
How do I ensure my monitoring system remains reliable?
Monitor your monitoring by collecting metrics about Prometheus and Grafana themselves. Deploy multiple instances for high availability, implement proper backup strategies, and test recovery procedures regularly. Use infrastructure-as-code to enable rapid redeployment if needed. Establish clear operational procedures for common maintenance tasks. Most importantly, treat monitoring infrastructure as critical production systems deserving the same attention to reliability as the applications they observe.
What retention period should I configure for metrics?
Retention decisions balance storage costs against analysis needs. Most organizations find 15-30 days of local retention sufficient for operational monitoring and troubleshooting. Supplement local retention with remote storage for longer-term capacity planning and trend analysis. Consider your specific use cases: incident investigation typically needs recent data, while capacity planning benefits from seasonal patterns visible over months. Start conservative and extend retention if teams frequently need older data.