Monitoring Network Traffic with iftop and nload
Short introduction
Monitoring network traffic helps you spot bandwidth hogs, troubleshoot latency, and understand how services communicate on a machine. This tutorial walks through two lightweight, terminal-based tools — iftop and nload — with practical examples and a handy commands table so you can start observing traffic in minutes.
Installing iftop and nload
iftop and nload are available in most Linux distributions' package repositories and are tiny to install. iftop shows per-connection bandwidth usage and nload visualizes interface throughput as simple graphs — both require root privileges to see all traffic on an interface.
Example installation commands (Debian/Ubuntu, RHEL/CentOS, Arch):
# Debian / Ubuntu
sudo apt update
sudo apt install iftop nload

# RHEL / CentOS (with EPEL for older releases)
sudo dnf install iftop nload
# or
sudo yum install epel-release
sudo yum install iftop nload

# Arch Linux
sudo pacman -S iftop nload
Quick verification:
which iftop nload
iftop --version
nload --help
Commands table
Below is a compact reference table of commonly used commands and meanings to get you productive quickly.
| Tool | Purpose | Example |
|---|---|---|
| iftop | Real-time per-connection view | sudo iftop -i eth0 -n |
| iftop | Turn off name resolution | sudo iftop -n |
| nload | Per-interface bandwidth graphs | sudo nload eth0 |
| nload | Set unit to kilobits/s | sudo nload -u K eth0 |
| ip | Show available interfaces | ip link show |
| ss/netstat | Show socket connections | ss -tunp |
Notes:
- Use sudo or run as root; both tools need access to raw sockets to monitor the interface.
- The table examples are minimal; full option sets are available in each tool's man page.
Using iftop: real-time connection view
iftop focuses on showing which hosts and ports are exchanging traffic and how much bandwidth each connection consumes. It behaves like top (CPU view) but for network connections. By default, iftop attempts DNS and port name resolution which can slow the display — using -n and -N disables those lookups.
Start iftop on a given interface:
sudo iftop -i eth0
Start without DNS/port resolution for faster, clearer numeric display:
sudo iftop -i eth0 -n -N
Basic interactive keys (press while iftop is running):
- p — toggle port display
- n — toggle DNS name resolution
- N — toggle port name resolution
- t — cycle display modes (bandwidth, cumulative, etc.)
- h — show help within the program
- P — toggle display of per-protocol aggregation
Example: watch the top connections and sort by source-to-destination traffic:
sudo iftop -i eth0 -n -N
# Then press: t (to choose display) and p (to toggle ports)
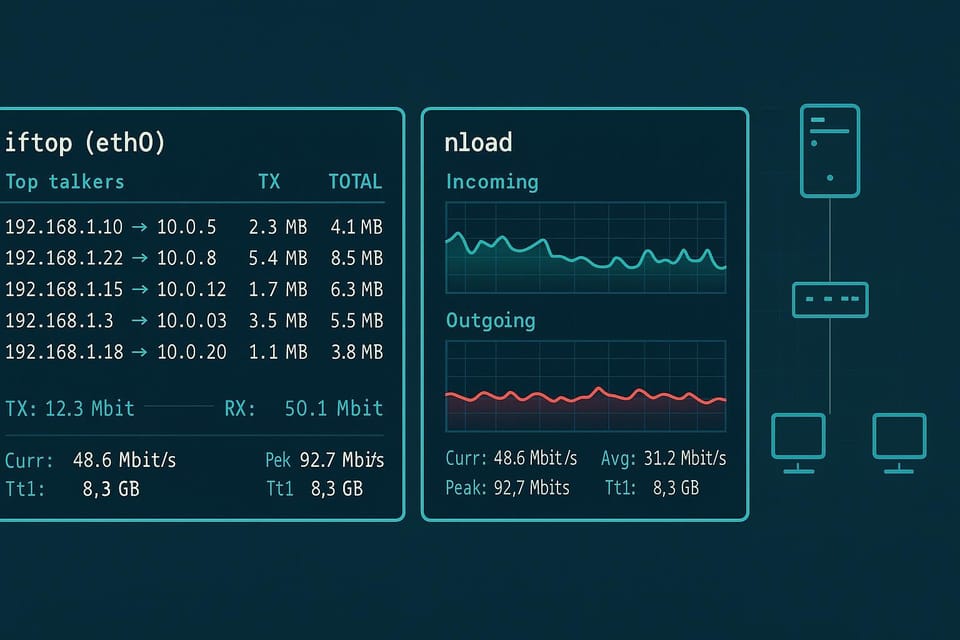
Understanding the display:
- The center lists active connections and their recent bandwidth (2s / 10s / 40s averages).
- The left and right columns show sent/received totals for hosts overall.
- You can see how bandwidth is distributed across many small flows or dominated by one big transfer.
Filtering with iftop:
To filter traffic (like only HTTP or a subnet), use pcap-style filters:
sudo iftop -i eth0 -f "tcp port 80"
sudo iftop -i eth0 -f "net 192.168.1.0/24"
Practical tip: when diagnosing slow application behavior, run iftop and sort by the most active flows — that often points you to either a noisy background sync, a backup, or a misbehaving client.
Using nload: interface bandwidth graph
nload provides a simple, curses-based graph of incoming and outgoing traffic for a given interface. It's ideal when you just need to see aggregate throughput (not per-connection details).
Start nload for a single interface:
sudo nload eth0
Change units or sampling interval:
# Use kilobits/s units, refresh every 500 ms
sudo nload -u K -t 500 eth0
Key parts of the nload display:
- Left or top panel: incoming traffic graph and stats (current, max, average)
- Right or bottom panel: outgoing traffic graph and stats
- Simple summary at the top with device name and total bytes
If you start nload without specifying an interface, you get a small menu to pick one:
sudo nload
# then use arrow keys to select an interface, Enter to view
Using nload in scripts or logging:
nload is primarily interactive, but you can combine it with tools like vnstat for longer-term logging. For short captures you can use command-line tools to output samples. For example, capture periodic bytes from /sys/class/net:
# simple sample of rx/tx bytes every 1s (not nload, but useful for logging)
while true; do
  RX=$(cat /sys/class/net/eth0/statistics/rx_bytes)
  TX=$(cat /sys/class/net/eth0/statistics/tx_bytes)
  echo "$(date +%T) RX=$RX TX=$TX"
  sleep 1
done
Read the graphs as trends rather than perfect precision — nload is great to spot spikes, sustained usage, and direction (in vs out).
Common Pitfalls
Misinterpreting DNS/port lookups as slowness: iftop defaults to resolving IPs and ports to names which can introduce lag. Use -n and -N to get immediate numeric output:
sudo iftop -i eth0 -n -N
Watching the wrong interface: virtual machines, containers, or systems with multiple NICs often use different interface names (ens33, eth0, wlan0). Check with:
ip link show
Forgetting sudo/root privileges: both tools need raw socket access. If you get empty output or permission errors, run with sudo.
# Correct: run as root
sudo iftop -i eth0
Next Steps
- Add long-term monitoring: deploy vnStat, Prometheus exporters, or system monitoring (Grafana + node exporter) for historical bandwidth trends beyond live inspection.
- Learn packet analysis: use Wireshark or tshark to inspect payloads and protocols once you identify a problematic flow with iftop/nload.
Automate short-term captures: combine iftop/nload observation with tcpdump for packet-level captures when you spot suspicious traffic.
sudo tcpdump -i eth0 host 10.0.0.5 -w suspicious.pcap
Closing note: iftop and nload are excellent first-line tools — fast to install, easy to run, and low overhead for interactive troubleshooting. Use them to quickly narrow down where bandwidth is going, then escalate to packet captures or long-term collectors when you need deeper analysis.
👉 Explore more IT books and guides at dargslan.com.